Step 1: Getting Your Data In
First up click on “Start a Chat” or “New Chat” depending on where you started from. Give it a click! You can upload pretty much anything here, whether it’s a CSV, Excel file, JSON, or even google sheet files. If the file is on your device, click on “Upload” and find the file you want to upload. If you want to upload something from Google Sheets, choose that option and a box will pop up. Paste the url from your google sheet and give it a name then click on “Connect”. Once you upload or link your file, it’ll pop up in your data sources list like magic.


Step 2: Starting your chat
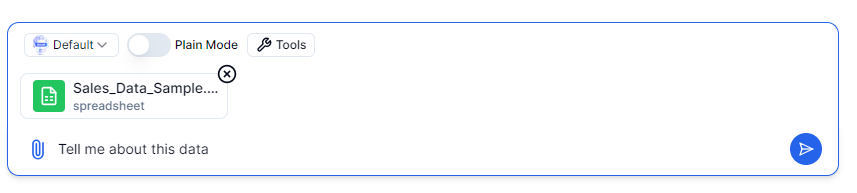
Once you see your data attached to the box, you can either leave the text box blank or type a prompt you want Julius to do with it like, “Tell me about this data” or something like that, then press the blue send icon to get started with the chat!
Step 3: Analyzing the data
This is where the fun starts! With your data source in place, you can ask Julius to do some data magic. Need to see average sales by category or sort data by age? Just ask! Julius turns your words into Python code and gets the job done, whether it’s filtering, sorting, crunching numbers, or whatever you need. Here I asked, “What is the most popular product in my list? How much was earned from it?”


Step 4: Visualizing your findings
Want to see your data in full color? Ask Julius for a visual. Bar plots, line graphs, histograms, scatter plots, pie charts – you name it. Just tell Julius what you want, like “create a visual that’ll show me my top 10 products by sales,” and bam, you get a neat chart in the chat. See a graph you love? Click on the download button on the right side of your graphic to save it to your computer.

Step 5: Taking Your Data Home
Made some tweaks and want to take your data with you? Just let Julius know you’d like to export it. Type a prompt that tells Julius “export my data” or “download this data” and you’ll get a link to download your data masterpiece. Click on this link and it should save the file to your device.

And that’s it! You’re all set to explore, analyze, and visualize data with Julius. Have fun and see what amazing insights you can uncover! ![]()